MKTG402(3) Labs
Preface
This is a website for the workshops of MKTG402(3) - Introduction to Quantitative Research Methods for students at the Advanced Marketing Management (AMM) program at Lancaster University.
Instructor: Professor Ahmad Daryanto
Document Version
The pdf version of this document is available to download from Moodle.
SPSS Version
I am using SPSS version 28. You can use any SPSS versions (e.g., ver 26, 27, and 29), where the statistical procedures used in the labs are the same but the output formats are slightly different from those of version 28. Therefore, I recommend you to use version 28, so you can check whether your outputs are the same with those shown in this document.
Textbook
Core text

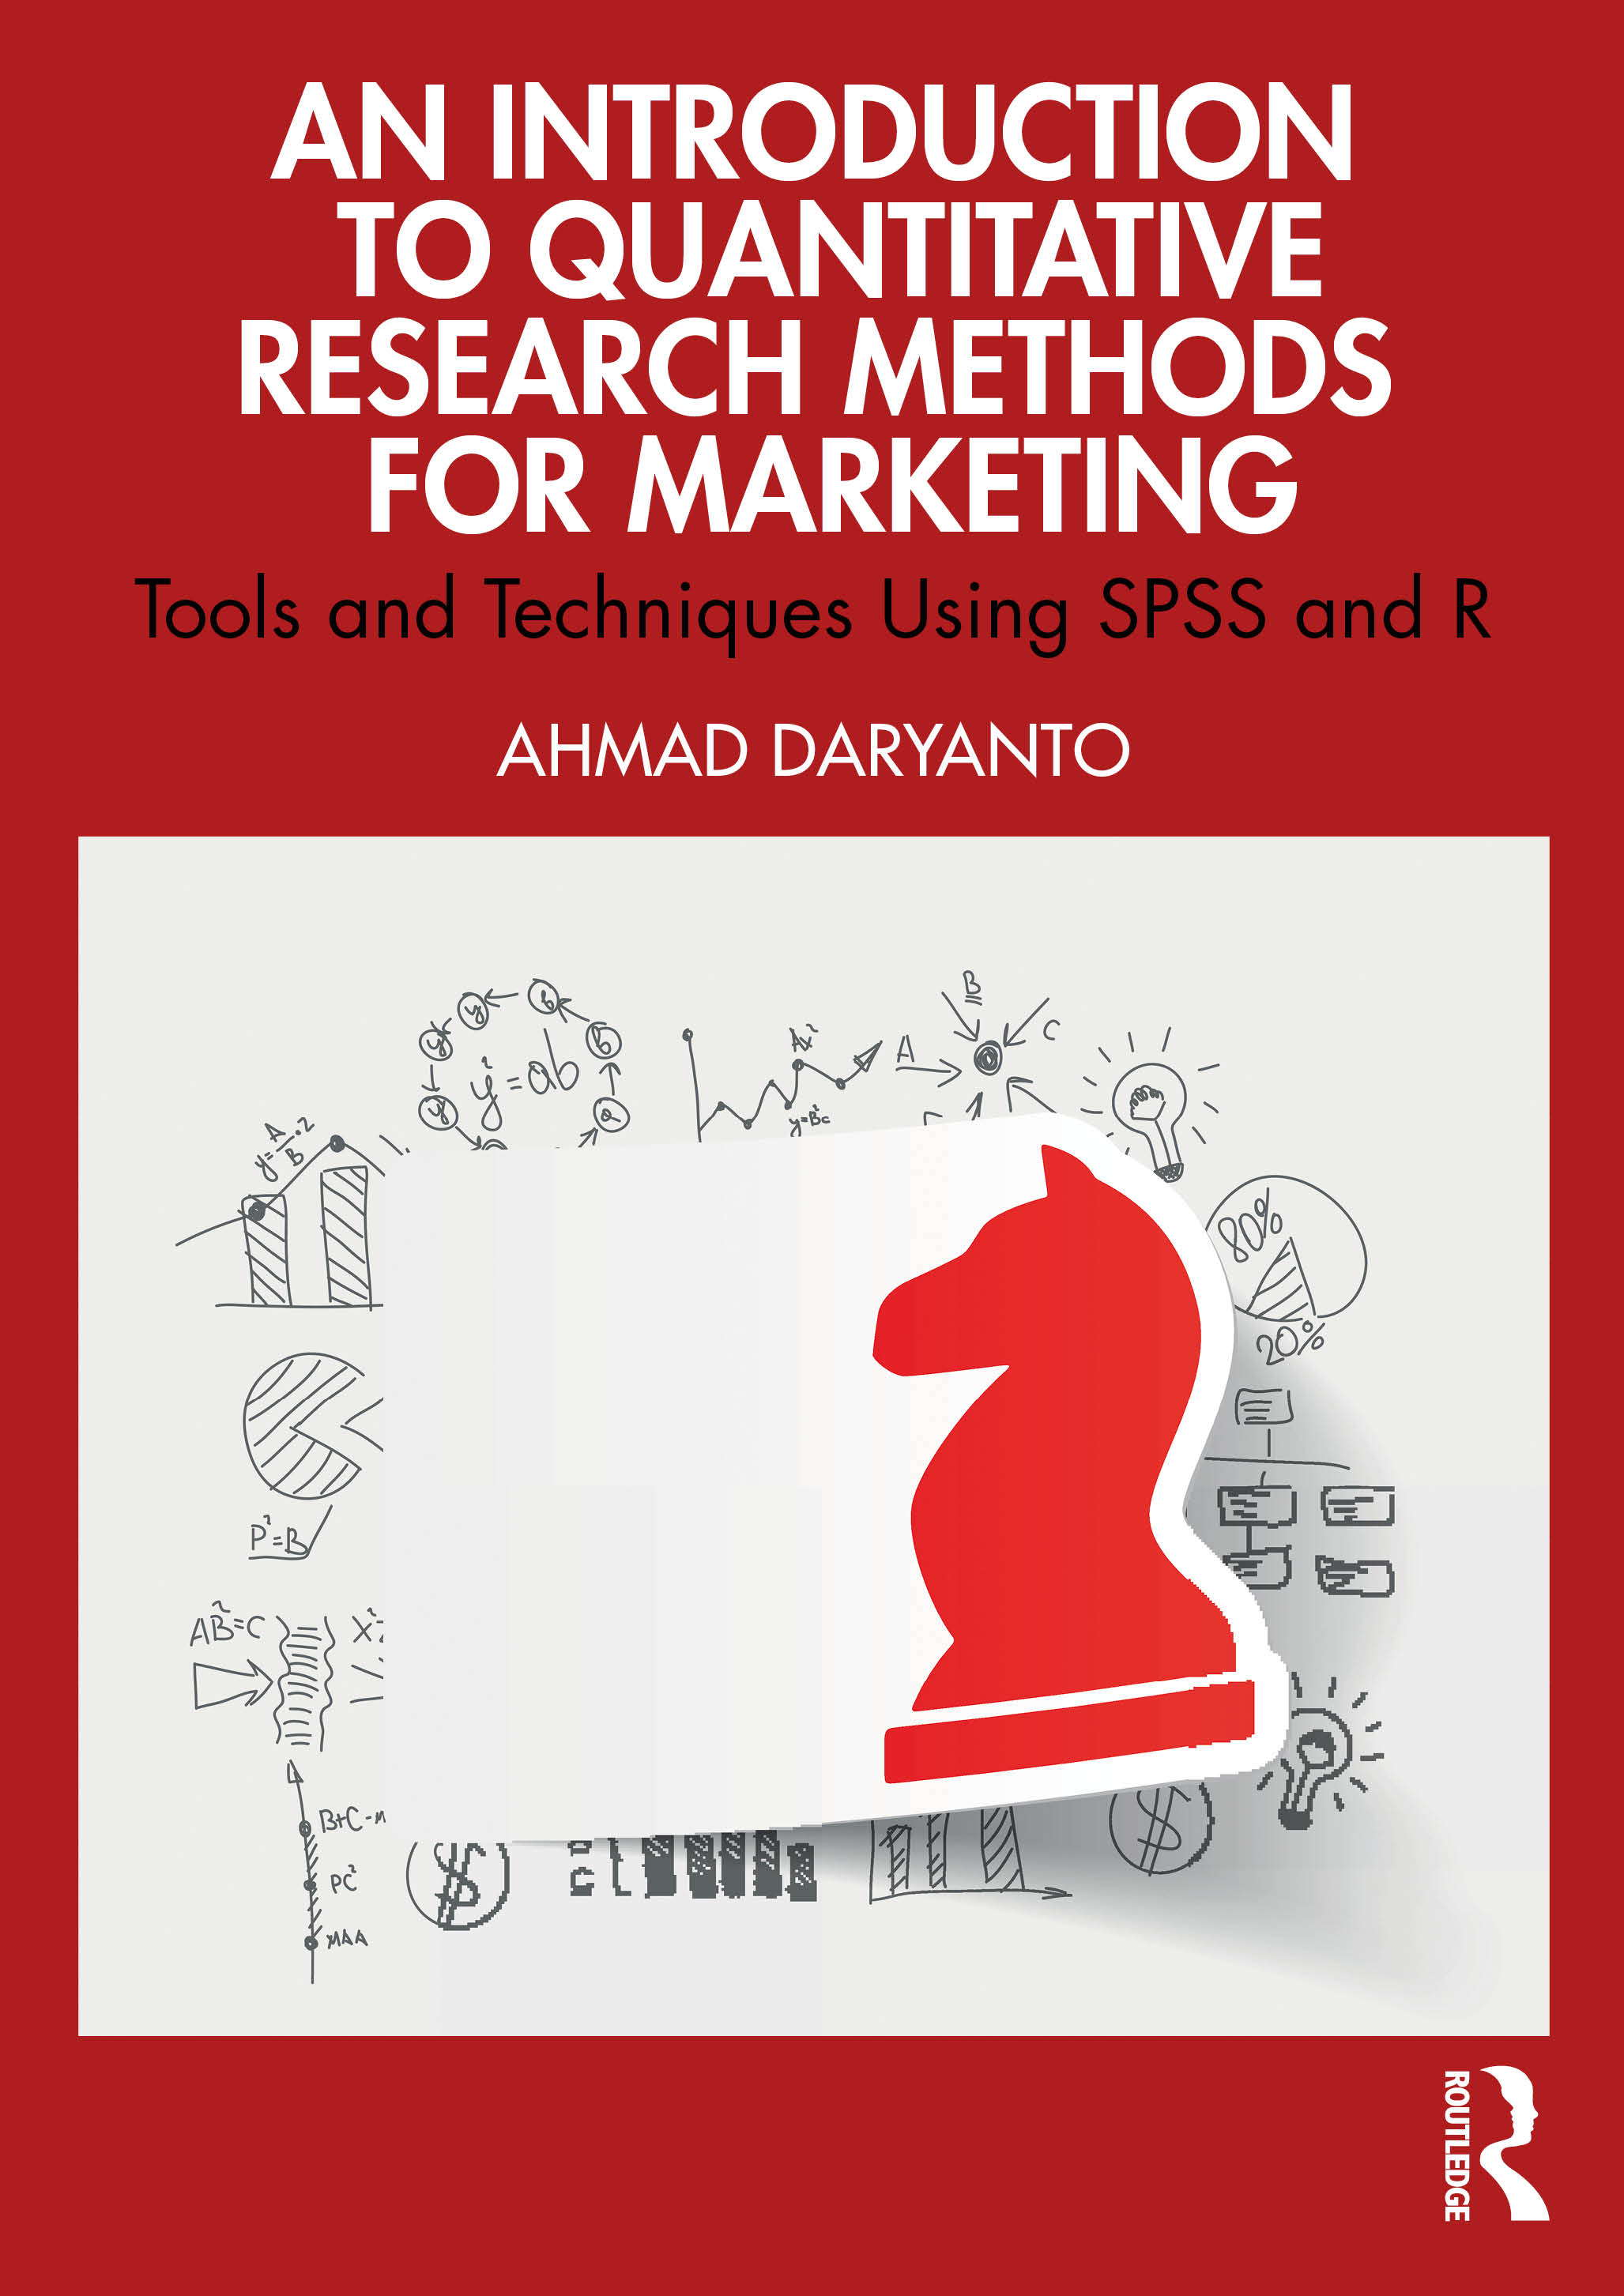
Daryanto, Ahmad. (2025), ‘An Introduction to Quantitative Research Methods for Marketing: Tools and Techniques Using SPSS and R’, 1st Edition, Routledge. This book is written by yours truly. It will be useful for those who wants to learn SPSS in more depth and R. As stated in the publisher website, this is “a very applied text designed to make this complex subject accessible to students with no background in quantitative methods, this book is valuable recommended and core reading for advanced undergraduate and postgraduate.” If your laptop is connected to the university’s eduroam network, the book can be accessed via ProQuest Ebook Central or OneSearch.
Recommended
Any marketing research or quantitative research textbook can be used to complement the core text for your self-learning, in particular, I recommend the following text:
Malhotra, N.K, Birks, D., and Wills, P. (2012) Marketing Research: An applied orientation, 4th edition, London: Prentice-Hall, Pearson. Other books on marketing research by Malhotra are also useful.
Sarstedt, Marko and Erik Mooi (2014). A Concise Guide to Market Research. Springer. As the title suggests, this book is concise focusing statistical tests typically conducted in market research. You can read the e-version of the first edition via our library website.
Feinberg, Kinnear, and Taylor. (2013). Modern Marketing Research: Concept, Methods, and Cases, 2nd edition, Cengage. Written by excellent researchers in Marketing, I also like this book. It has plenty of mini cases that help readers to see the application of concepts in practices.
Overview
Workshop 1/ Week 13: Getting started with SPSS
Tasks: In this workshop, we will label variables, create new ones, and code scales.
Workshop 2/ Week 14: Descriptive statistics, graphs and charts in SPSS
Tasks: In this workshop, we will use SPSS to produce descriptive statistics, graphs and charts for different types of variables.
Workshop 3/ Week 15: Crosstabs and two independent samples t-test
Tasks: This is the first of the bivariate analysis workshops. Here we will look at the analysis of 2 sets of nominal data in a cross tabulation and use a Chi-square test to determine whether a significant difference between the groups has occurred. In the second part of the workshop, we will look at the analysis of mean scores, i.e., comparing mean scores of two groups with two independent samples T-test.
Workshop 4/ Week 16: ANOVA and Experimentation
Tasks: Here we will use SPSS to compare the mean scores of two or more nominal groups. Using one-way ANOVA, we will determine if significant differences exists between two groups or more. Then we will look two-way ANOVA, specifically a 2x3 ANOVA between-subject design.
Workshop 5/ Week 17: Regression
Tasks: Using correlation we will determine the nature of the association between two sets of interval or ratio data. Then using linear regressions, we will develop a model to examine the influence of a set of independent variables on one dependent variable.
Additional Workshop: Influential Observations (to be deployed in the academic year 2025/26)
Tasks: We will learn how to detect observations that can distort regression results: influential observations. We use two widely used measures in the influential analysis: Cook’s distance and DFBetas. Next, we learn how to run regression without including the influential observations but still retaining them in our data set.